Hello MapD (Local)
Most examples use sample datasets. To appreciate the value of MapD, it is important that you work with your own data sets.
This topic demonstrates how you can:
- Install a local MapD repository and import a dataset.
- Clone the mapd-connector repository.
- Connect to a local MapD server instance.
- Retrieve the results of a SQL query.
- Display the results on an HTML page.
Install
Before you continue, install and run a local MapD server instance following one of the Installation Recipes. The Docker CPU instance is perhaps the most straightforward option.
Use the example below as a boilerplate to access your own dataset. This example uses the UFO sightings dataset. You can import the UFOs database using the Immerse Data Import utility.
Clone
Much of the underlying infrastructure you need to interact with a MapD server is provided by the mapd-connector repository. You can clone the repository locally to take advantage of its utilities.
- Go to https://github.com/mapd/mapd-connector.
- Click Clone or Download.
- Choose whether to clone the repository using HTTPS or SSH, or optionally download a Zip archive to expand on your local drive.
mapd-connector repository:For more information on cloning GitHub repositories, see https://help.github.com/articles/cloning-a-repository/
Open mapd-connector/examples/local_browser.html in a web browser to connect to your local MapD server instance and display information from the UFOs database. You can open mapd-connector/examples/local_browser.js in a text editor and follow along as the following sections describe how the script connects, retrieves, and displays data from the MapD server.
Connect
The lynchpin of the application is establishing a connection to MapD. Fortunately, the MapdCon object does the heavy lifting for you. You provide the location and port of the MapD host and your user credentials to create a connection.
const connector = new window.MapdCon()

connector
  .protocol("http") //by default, the server uses http protocol
  .host("localhost")
  .port("9092")
  .dbName("mapd")
  .user("mapd")
  .password("HyperInteractive")
  .connectAsync()
Retrieve
Connecting to the MapD server is not the final goal, of course. Once you have a connection, you can send SQL queries to retrieve data.
First, create constant variables for your SQL queries.
// Count the number of cigar shaped UFOS.
const query =
"SELECT count(*)  AS n FROM UFOs WHERE sighting_type='cigar'"

// Count the number of up to 100 sighting types.
const query2 =
  "SELECT sighting_type as Shape, count(*) as Number_Of_Instances FROM UFOs group by sighting_type LIMIT 100"
Create an empty array for your query options.
const defaultQueryOptions = {}
Connect as shown above.
const connector = new window.MapdCon()

connector
  .protocol("http")
  .host("localhost")
  .port("9092")
  .dbName("mapd")
  .user("mapd")
  .password("HyperInteractive")
  .connectAsync()
Use a promise to send a series of queries, including the ones defined as constants.
  .then(session =>
    // now that we have a session open we can make some db calls:
    Promise.all([
      session.getTablesAsync(),
      session.getFieldsAsync("UFOs"),
      session.queryAsync(query, defaultQueryOptions),
      session.queryAsync(query2, defaultQueryOptions)
    ])
  )
Display
Promise returns a values object with an array of query results. The first item in the values array is a list of tables. Write the results to the browser console.
  .then(values => {
    console.log(
      "All tables available at localhost:",
      values[0].map(x => x.name)
    )
The second item in the array contains a list of fields in the table flights_donotmodify.
    // handle result of getFieldsAsync
    console.log(
      "All fields for 'UFOs':",
      values[1].reduce((o, x) => Object.assign(o, { [x.name]: x }), {})
    )
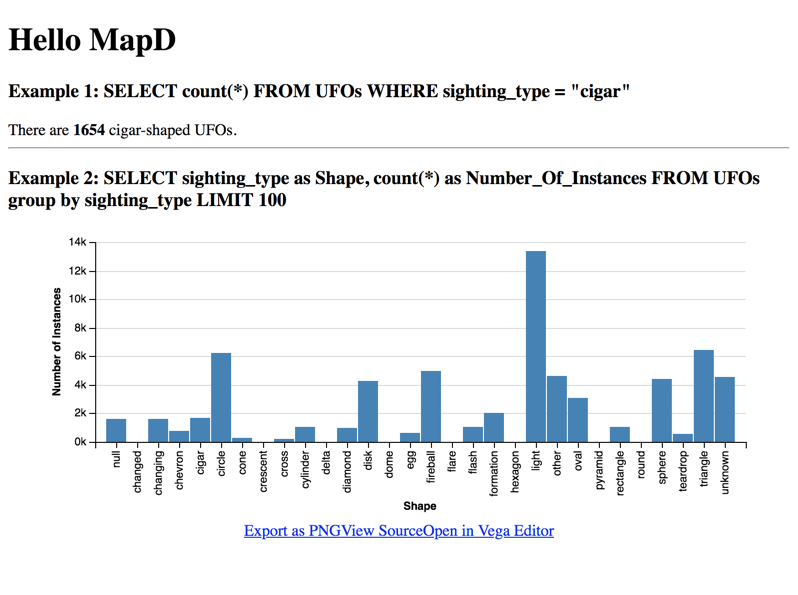
The third query contains a count of cigar-shaped UFOs.
    // handle result of first query
    document.getElementById("result-async").innerHTML =
      "There are " + values[2][0].n + " cigar-shaped UFOs."
    console.log("Query 1 results:", Number(values[2][0].n))
The final query returns a count of each UFO Shape (sighting_type) in the UFOs table, with a limit of 100 records. Display the results as a chart using a Vega-Lite chart.
    // handle result of 2nd query
    var results = values[3].map((o, x) => Object.assign(o, { [x.key0]: x.val },), {})
  .catch(error => {
    console.error("Something bad happened: ", error)
  })
Use the array to create a chart using Vega-Lite. For more information, see Introduction to Vega-Lite
var vlSpec = {
  data: { values: results},
  mark: "bar",
  encoding: {
    x: {
      field: "Shape",
      type: "nominal",
      axis: {title: "Shape"}
    },
    y: {
      field: "Number_Of_Instances",
      type: "quantitative",
      axis: {title: "Number of Instances"}
    }
  }
};

console.log (vlSpec);
var embedSpec = {
    mode: "vega-lite",
    spec: vlSpec
};

// Embed the visualization in the container with id `vis`
vg.embed("#vis", embedSpec, function(error, result) {  });

  })  .catch(error => {
    console.error("Something bad happened: ", error)
  })