Logs and Monitoring
OmniSci writes to system logs, including errors related to NVIDIA components and other issues. For RHEL/CentOS, see /var/log/messages; for Ubuntu, see /var/log/syslog.
OmniSci uses rotating logs with a symbolic link referencing the current OmniSci server instance. Logs rotate when the instance restarts. These logs are located in the mapd_log directory within the $MAPD_DATA/data directory.
You can also view the most comprehensive log using the following command line entry:
journalctl -e -u mapd_server
To follow the logs as you interact with the data, use the following syntax in a terminal window:
tail -f *.INFO
Log Entry Types
mapd_server.INFO
Provides verbose general logging regarding such topics as:
- User connections
- Queries by user and session ID with timings
- Execution time - time for the query to execute
- Total time - execution time plus time spent waiting to execute
- Data loading
I1229 22:58:43.816704 15766 MapDHandler.cpp:568]
sql_execute :PqAzLUwHEP1z9C4ffsX6zOW5nxoDVXa0:query_str:select count(*) from cc_trans;
I1229 22:58:43.817028 15766 Calcite.cpp:247] User mapd catalog mapd sql 'select count(*) from cc_trans;'
I1229 22:58:43.820521 15766 Calcite.cpp:260] Time in Thrift 0 (ms), Time in Java Calcite server 3 (ms)
I1229 22:58:43.882936 15766 MapDHandler.cpp:586] sql_execute-COMPLETED Total: 66 (ms), Execution: 65 (ms)
mapd_server.WARNING
Reports warning messages. For example:
W1229 09:13:50.888172 36427 RenderInterface.cpp:1155] The string "Other" does
not have a valid id in the dictionary-encoded string column "card_class"
(aliased by "color") for table cc_trans.
mapd_server.ERROR
- Reports non-fatal error messages. For example:
E1227 13:15:38.272478 18054 QueryRenderer.cpp:178]
JSON parse error [userId: vdp73CcaJh9HOFS5PlKrualA2rcygP0Y, widgetId: 1]
obj: {}: "width" is not defined.
mapd_server.FATAL
Reports `check failed` messages and a line number to identify where the error occurred. For example:
F1022 19:51:40.978567 14889 Execute.cpp:982]
Check failed: cd->columnType.is_string() && cd->columnType.get_compression() == kENCODING_DICT
Browser-based live logging
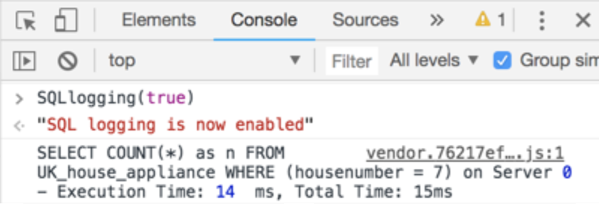
Using Chrome’s Developer Tools, you can interact with data in Immerse to see
SQL and response times from OmniSci Core. The syntax is SQLlogging(true),
entered under the console tab inline, as shown below.

Once SQL Logging is turned on, you can interact with the dashboard, see the SQL generated and monitor the response timing involved.
Monitoring
Monitoring options include the following.- You can run
nvidia-smion each node to view each node's GPU saturation. - You can use
systemdin non-Docker deployments. - You can make mapdql monitoring calls using Thrift.
Distributed Deployment Monitoring
You can use the mapdql\status command for cluster monitoring in
distributed deployments. It returns the following information:
- Server Version Number
- Server Start Time
- Number of Leaves
- Name of Leaf
- Leaf Version Number
- Leaf Start Time
Detailed memory monitoring
\memory_summary outputs a hybrid summary of CPU and GPU memory
allocation. OmniSci Server CPU Memory Summary shows the maximum amount of memory
available, what is in use, allocated and free. OmniSci allocates memory in 2 GB
fragments on both CPU and GPU. OmniSci Server GPU Memory Summary shows the same
memory summary at the individual card level. Note: OmniSci does not pre-allocate
all of the available GPU memory.
A cold start of the system could look like this:
MapD Server CPU Memory Summary:
           MAX            USE      ALLOCATED           FREE
  412566.56 MB        8.19 MB     4096.00 MB     4087.81 MB


MapD Server GPU Memory Summary:
[GPU]            MAX            USE      ALLOCATED           FREE
 [0]    10169.96 MB        0.00 MB        0.00 MB        0.00 MB
 [1]    10169.96 MB        0.00 MB        0.00 MB        0.00 MB
 [2]    10169.96 MB        0.00 MB        0.00 MB        0.00 MB
 [3]    10169.96 MB        0.00 MB        0.00 MB        0.00 MB
After warming up the data, the memory could look like this:
MapD Server CPU Memory Summary:
           MAX            USE              ALLOCATED     FREE
  412566.56 MB     7801.54 MB     8192.00 MB      390.46 MB


MapD Server GPU Memory Summary:
[GPU]            MAX            USE      ALLOCATED     FREE
 [0]    10169.96 MB     2356.00 MB     4096.00 MB     1740.00 MB
 [1]    10169.96 MB     2356.00 MB     4096.00 MB     1740.00 MB
 [2]    10169.96 MB     1995.01 MB     2048.00 MB       52.99 MB
 [3]    10169.96 MB     1196.33 MB     2048.00 MB      851.67 MB
