
Working with Dashboards
You can construct a OmniSci Immerse dashboard following these steps:
Once you save the dashboard, you can share it with other OmniSci users.
Starting a New Dashboard
Connect to OmniSci Immerse by pointing a web browser to port 9092 on your OmniSci Core Database server. When you launch OmniSci Immerse, the landing page is a list of saved dashboards. You click New Dashboard in the upper right to configure a custom dashboard.
Adding a chart
To add a chart, you click Add Chart, choose a chart type, set dimensions and measures, then click Apply. For more information on creating charts, see OmniSci Immerse Chart Types.
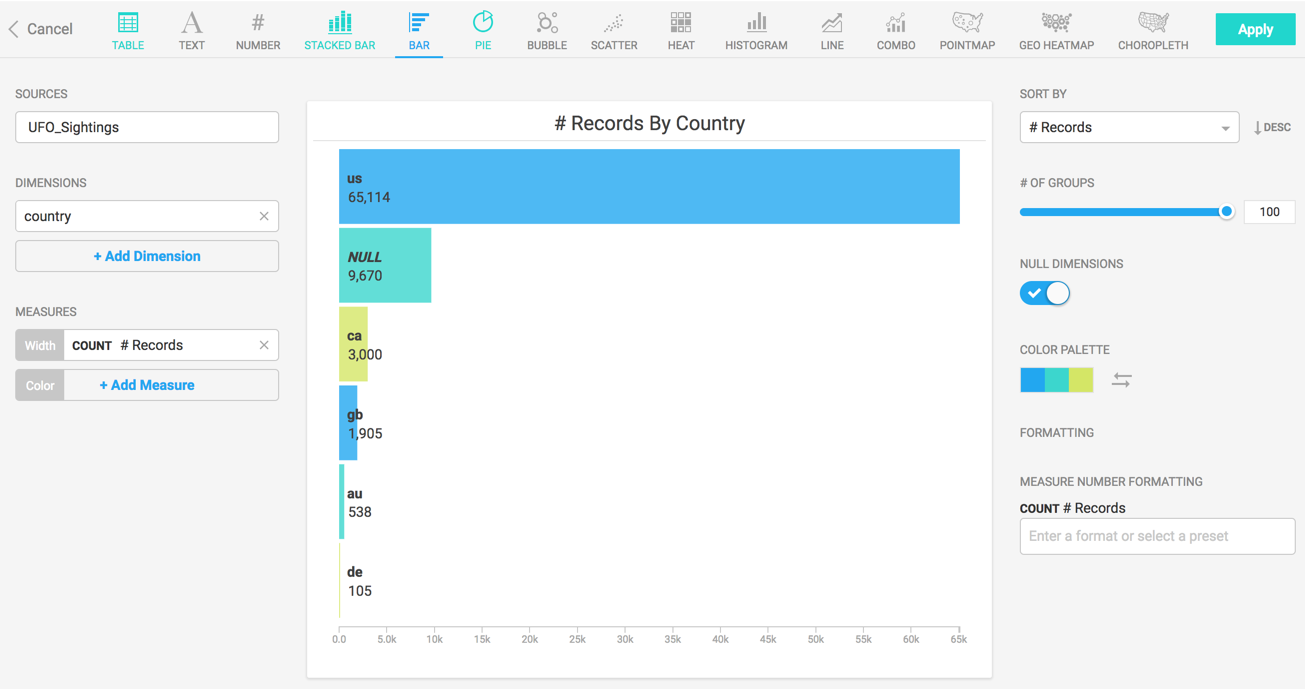
To create a chart:
- Click Add Chart.
- Choose a Data Source. For example, UFO_Sightings.
- Choose a chart type. For example, Bar.
- Set the Dimension. For example, country.
- Set the Measure. For example, COUNT # Records.
- Click Apply.
Titling and Saving a Dashboard
To title and save a dashboard:
- Click the title area.
- Type a title.
- Click Save.
Modifying Dashboards
Moving/resizing charts
To move a chart within a dashboard, click the title bar and drag the chart to the new location. If there is already at that location, it moves aside.
To resize the chart, click on the lower right corner of the chart and drag to change the size.
Cross-filtering
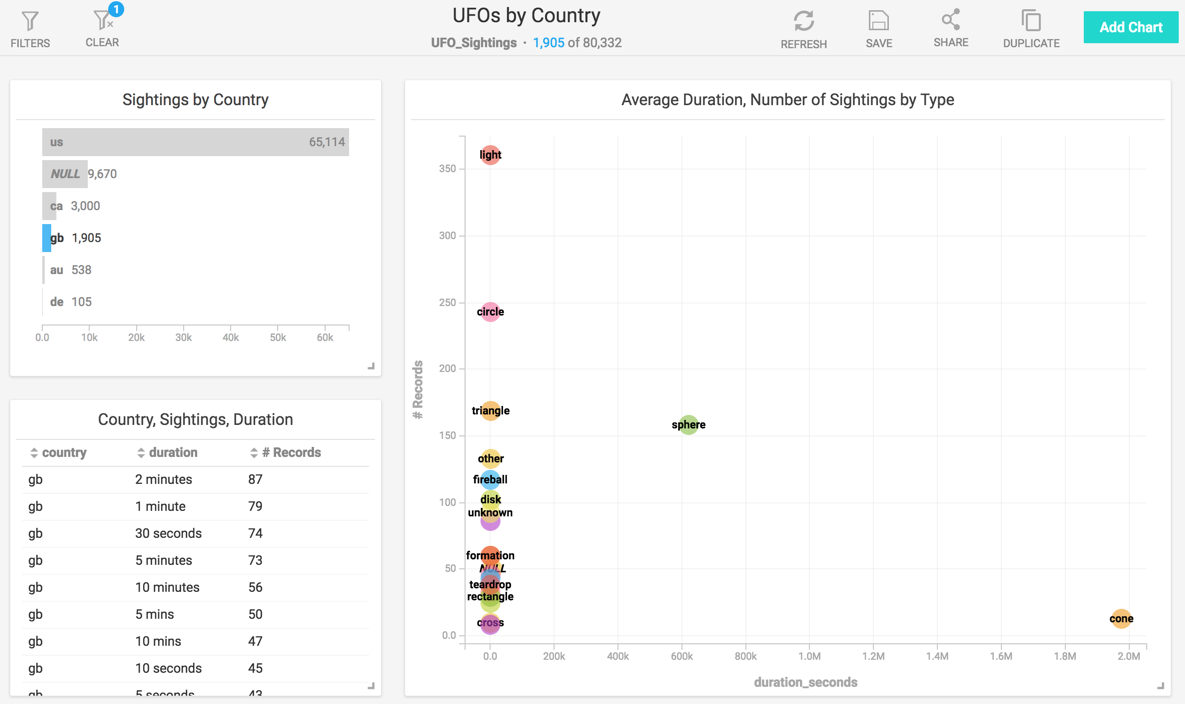
When you add more than one chart to a dashboard, filters on one chart affect all other charts on the dashboard.
For example, the dashboard below shows UFO Sightings in various countries.
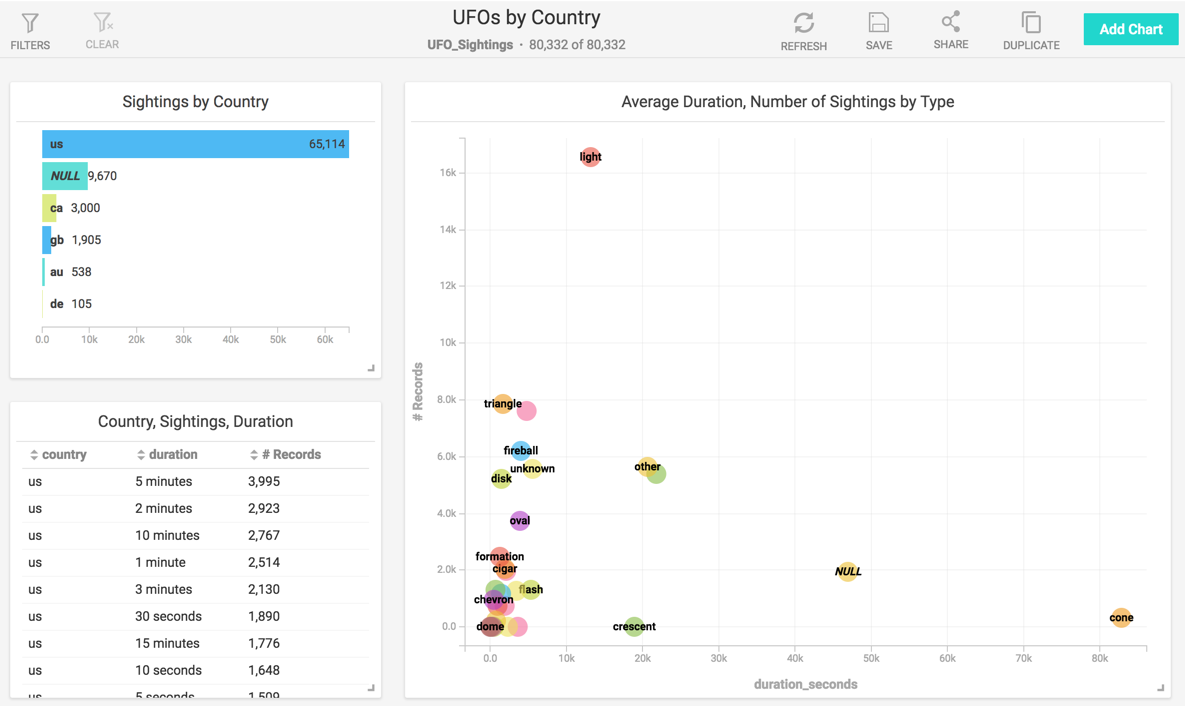
If you click the bar for Great Britain (gb) on the “Sightings by Country” chart, the other charts are filtered, as well.
Multi-source Dashboards
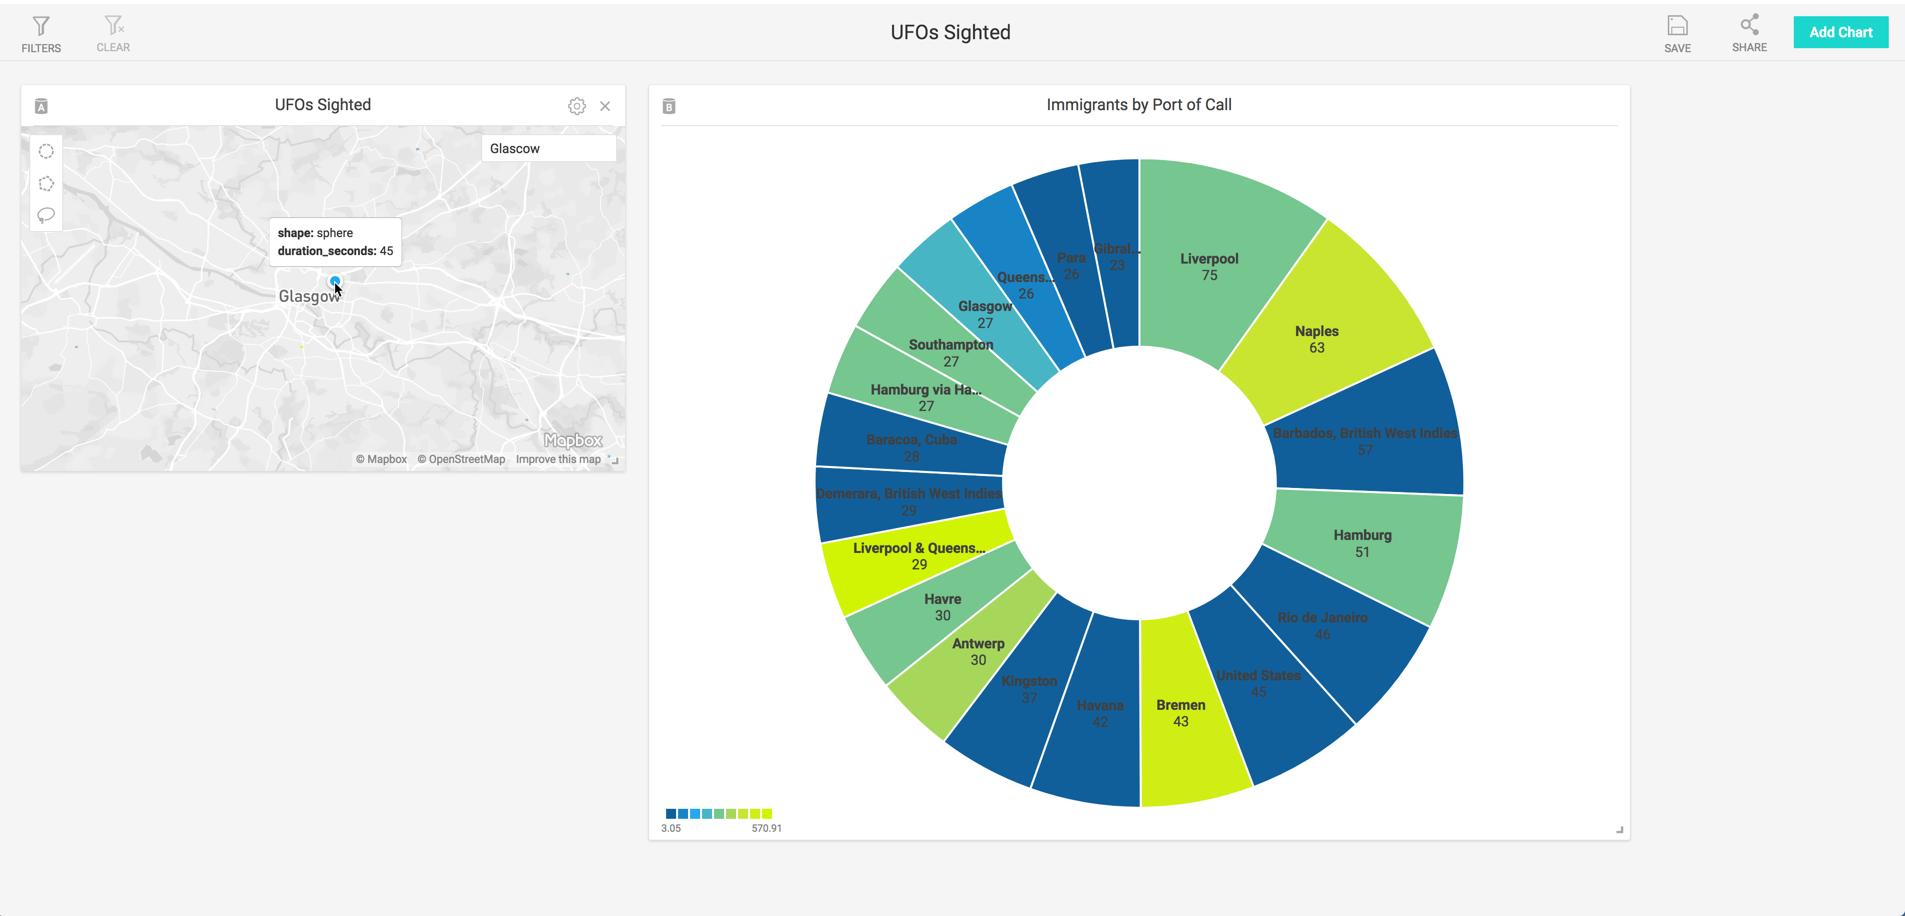
You can choose different data sources for individual charts on your dashboard. This lets you look for visual correlations in datasets that are not directly connected.
For example, these charts compare immigration rates to UFO sightings. Glascow looks suspicious.
Exporting Chart Data in CSV Format
You can export data in .csv file format for individual charts on your dashboard. You can view the CSV files in a typical spreadsheet application, like Microsoft Excel or Google Sheets.
The exported data matches exactly the data represented in the chart at the time of export; this includes any filters, binning, domain settings, or other settings. To export chart data in CSV format:
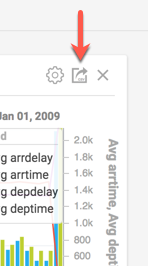
- Hover the mouse over the chart.
- In the upper-right corner of the chart, click the Export CSV icon.
The CSV file is downloaded to the default downloads folder for your browser.
Notes:
- You cannot export a CSV file for Choropleth, Geo Heatmap, Pointmap, or Scatter Plot charts.
- Any nested data (for example, a histogram with stacked data) is flattened.
Refreshing a Dashboard
If you update your dataset, you can update your dasboard by using the Refresh icon in Immerse.
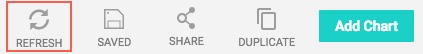
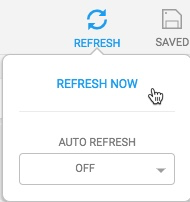
- Click Refresh.
- Choose Refresh Now.
If you have streaming data continually updating your dataset, you can set an interval to automatically refresh your dashboard.
- Click Refresh.
- Click Auto Refresh.
- Choose an interval (for example, 2 Minutes).
To turn off Auto Refresh, set the interval to Off.
| Note | Using your browser refresh button ends your session and requires you to log in again. |
Duplicating a Dashboard
You can duplicate a dashboard and use it as a starting point for a different dashboard.
To duplicate a dashboard:
- Click Duplicate.
- Click the Pencil icon to edit the name of the dashboard.
- Click Save.
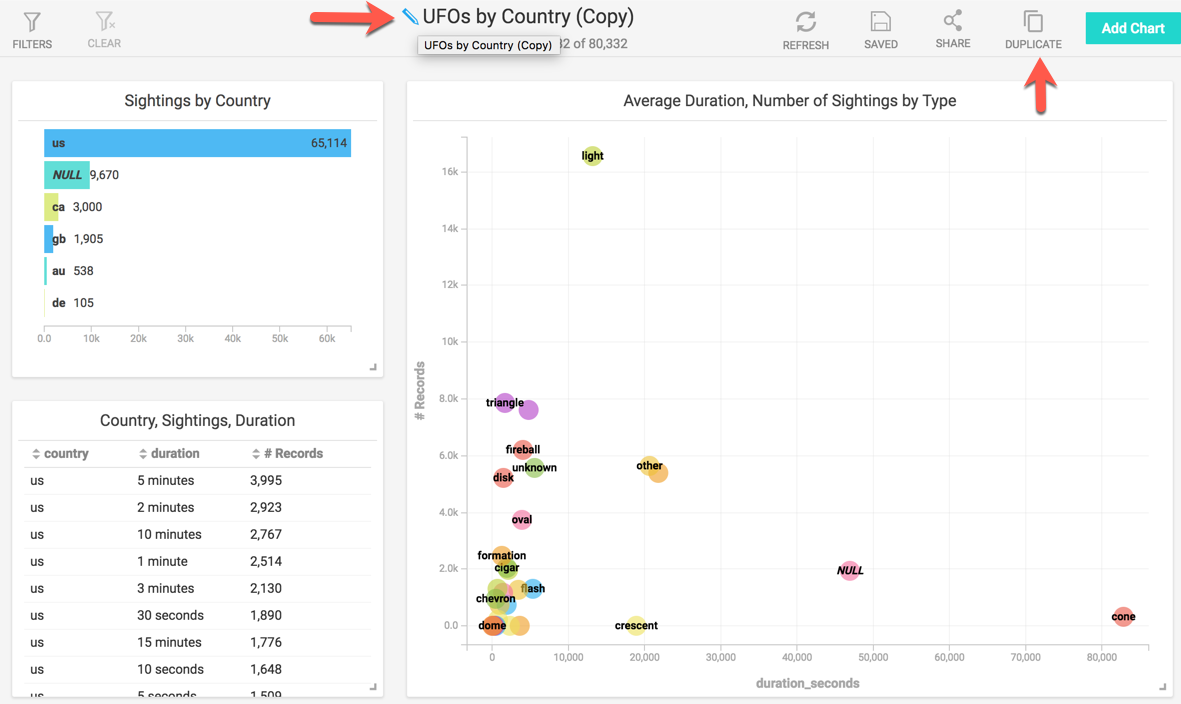
A new, identical dashboard is created, with (Copy) appended to the original dashboard name.
| Important | Use Duplicate to create a copy of a dashboard; do not rename a dashboard and save it. If you rename a dasboard and then save it, the original dashboard is overwritten with the renamed dashboard, and no duplicate is created. |
Sharing a Dashboard
Once you save a dashboard, you can share it with specific users or roles.
To share a dashboard:
- Click Share.
- Click the Search field to browse a list of users and roles. You can also type the first few characters of a user or role name to search.
- Click to select a user or role. To remove a user or role, click the x at the end of the row.
- Click the Copy icon at the bottom to copy the dashboard URL.
- Click Apply.
- Send the URL to the selected users and let them now they are authorized to use the dashboard.
When viewing the dashboard, you can click the Share icon at any time to add or remove users.
On the Dashboards page, the Shared column lets you distinguish between dashboards you have shared versus dashboards shared with you by others.
| Dashboards you have shared | |
| Dashboards others have shared with you |
Exporting and Importing a Dashboard Definition
You can use mapdql to export a dashboard definition as a JSON file, then import the dashboard definition to another OmniSci instance.
To export a dashboard definition:
Start mapdql.
Enter the following backslash command:
\export_dashboard "<dashboard-name>" <file-path>
Where
<dashboard-name>is the name of the dashboard in Immerse and<file-path>is the name and location to create the JSON file.For example:
mapdql> \export_dashboard "Sample Dashboard" /home/mapd/exported_dash.json
To import a dashboard definition:
Copy the export file to a location available to another OmniSci instance.
Enter the following backslash command.
\import_dashboard "<dashboard-name>" <file-path>
Where
<file-path>is the location and name of a file exported from another OmniSci instance.For example:
mapdql> \import_dashboard "Sample Dashboard" /home/mapd/my_dashboard.json
Deleting a Dashboard
To delete a dashboard:
- Click Dashboards.
- Mouse over the dashboard you want to delete.
- Click X at the end of the dashboard row.